Workforce Statistics
Having a highly-skilled workforce in Rockville is one of the reasons why so many businesses call us home. Please also review Maryland’s Department of Labor statistics.
Some Key Workforce Statistics
- Total Workforce (Rockville residents): 36,108
- Residents with a Bachelor’s Degree: 64.3%
- Residents with a Graduate/Professional degree: 36.6%
- Rockville’s average unemployment rate in 2015: 3.6% (lowest in the State of Maryland among tracked municipalities)
- Rockville’s unemployment is consistently lower than the national average and often lower than the County’s as well. Covid-19’s worst impact as of Q2 2020 was an employment rate of 8.2%, lower than the County at 9.0%, the state at 9.8%, and the nation at 14.7%
Source: American Community Survey, 2009-2013; U.S. Census Bureau, On The Map Application, 2014; Maryland Department of Labor, Licensing, and Regulation, 2016
Over 35% of the jobs located in Rockville are in either Public Administration or Educational Services, which can largely be attributed to the City’s status as the seat of the Montgomery County Government and the presence of Montgomery College’s largest campus in the system. Additionally, there is a wealth of jobs in the field of professional, scientific, and technical services as Rockville is located along the I-270 Tech Corridor and is home to numerous biotech, IT, and research companies..
Resident Occupations, 2018
| Resident Occupations, 2018 | Value | Pct. of Total | U.S. | Pct. of Total |
|---|---|---|---|---|
| Employed civilian pop. 16 years and over | 36,108 | 100% | 152,739,884 | 100% |
| Management, professional, and related | 22,812 | 63.2% | 57,945,862 | 37.9% |
| Service | 4,568 | 12.7% | 27,272,863 | 17.9% |
| Sales and office | 6,050 | 16.8% | 33,711,613 | 22.1% |
| Farming, fishing, and forestry | 40 | 0.1% | 1,068,481 | 0.7% |
| Construction, extraction, and maintenance | 1,414 | 3.9% | 12,485,194 | 8.2% |
| Production, transportation, and material moving | 1,224 | 3.4% | 20,255,871 | 13.3% |
Source: U.S. Census Bureau, American Community Survey, latest 5-Year Estimates
Educational Attainment, 2018
| Educational Attainment, 2018 | Value | Pct. of Total | U.S. | Pct. of Total |
|---|---|---|---|---|
| Total Population 25 and Older | 47,410 | 100% | 218,446,071 | 100% |
| Less Than 9th Grade | 1,886 | 4.0% | 11,521,575 | 5.3% |
| 9th to 12th, No Diploma | 1,510 | 3.2% | 15,426,482 | 7.1% |
| High School Graduate (incl. equiv.) | 4,923 | 10.4% | 59,265,308 | 27.1% |
| Some College, No Degree | 6,603 | 13.9% | 45,027,332 | 20.6% |
| Associate Degree | 1,976 | 4.2% | 18,338,323 | 8.4% |
| Bachelor's Degree | 13,140 | 64.3% | 42,470,927 | 19.4% |
| Graduate or Professional Degree | 17,372 | 36.6% | 26,396,124 | 12.1% |
Source: U.S. Census Bureau, American Community Survey, latest 5-Year Estimates
Rockville boasts one of the most well-educated populations in the United States.
Commuting to Work, 2018
| Commuting to Work, 2018 | Value | Pct. of Total | U.S. | Pct. of Total |
|---|---|---|---|---|
| Workers 16 years and over | 35,747 | 100% | 150,571,044 | 100% |
| Car, truck, or van -- drove alone | 22,825 | 63.9% | 115,095,765 | 76.4% |
| Car, truck, or van -- carpooled | 3,015 | 8.4% | 13,671,979 | 9.1% |
| Public transportation (including taxicab) | 6,213 | 17.4% | 7,602,145 | 5.0% |
| Walked | 1,185 | 3.3% | 4,049,677 | 2.7% |
| Other means | 567 | 1.6% | 2,728,545 | 1.8% |
| Worked at home | 1,942 | 5.4% | 7,422,933 | 4.9% |
Source: U.S. Census Bureau, American Community Survey, latest 5-Year Estimates
Density of Jobs in the City of Rockville

Source: U.S. Census Bureau, On The Map Application, 2014

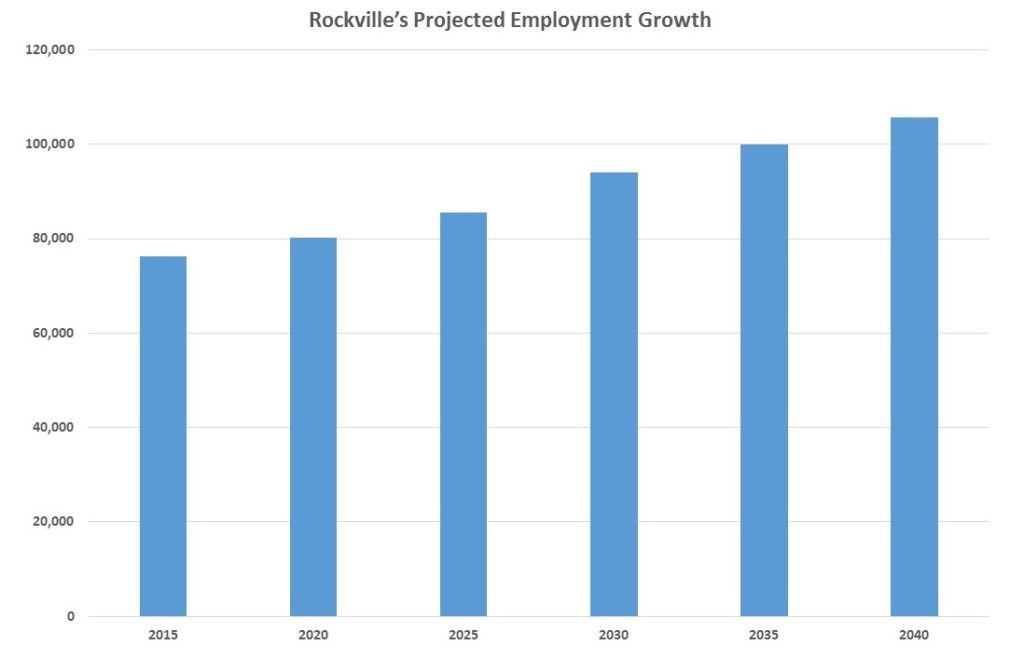
Rockville is projected to have 105,700 jobs by 2040, which translates to a 40% growth in employment from 2015. The Metro region is expected to grow at roughly the same rate during this period.
Source: Metropolitan Washington Council of Governments Round 8.4 Forecasts, October 2015.
Over 80% of Rockville’s employment growth is projected to be in office jobs through 2040, reflecting the continued preponderance of jobs in the professional, administrative, educational and health services; as well as scientific, management, and public administration positions.
Additional workforce data may be found at www.dllr.state.md.us/lmi
For information on Workforce Development & Training, see our Workforce Development page.
Rockville Jobs as of Q2 2020
- 68,595
Source: JobsEQ®
